PCA is a critical method for dimension reduction for high-dimensional data. High-dimensional data are data with features (p) a lot more than observations (n). However, this is changing with single-cell RNAseq data. Now, we can sequence millions (n) of single cells and each cell has ~20,000 genes/features (p).
I suggest you read my previous blog post on using svd to calculate PCs.
Single-cell expression data PCA
In single-cell RNAseq analysis, feature selection will be performed first. e.g. In Seruat, most variable genes will be calculated by FindVariableGenes and will be used for downstream analysis. The number of variable genes is in
the range of a couple of thousands (~2000). This further reduced number of features(p).
Let’s take a look at the source code of Seurat for
PCA:
if (rev.pca) {
    pcs.compute <- min(pcs.compute, ncol(x = data.use)-1)
    pca.results <- irlba(A = data.use, nv = pcs.compute, ...)
    sdev <- pca.results$d/sqrt(max(1, nrow(data.use) - 1))
    if(weight.by.var){
      gene.loadings <- pca.results$u %*% diag(pca.results$d)
    } else{
      gene.loadings <- pca.results$u
    }
    cell.embeddings <- pca.results$v
  }
  else {
    pcs.compute <- min(pcs.compute, nrow(x = data.use)-1)
    pca.results <- irlba(A = t(x = data.use), nv = pcs.compute, ...)
    gene.loadings <- pca.results$v
    sdev <- pca.results$d/sqrt(max(1, ncol(data.use) - 1))
    if(weight.by.var){
      cell.embeddings <- pca.results$u %*% diag(pca.results$d)
    } else {
      cell.embeddings <- pca.results$u
    }
  }
  rownames(x = gene.loadings) <- rownames(x = data.use)
  colnames(x = gene.loadings) <- paste0(reduction.key, 1:pcs.compute)
  rownames(x = cell.embeddings) <- colnames(x = data.use)
  colnames(x = cell.embeddings) <- colnames(x = gene.loadings)
and the help page for {Seruat::RunPCA}:
pc.genes
Genes to use as input for PCA. Default is object@var.genes

rev.pca
By default computes the PCA on the cell x gene matrix. Setting to true will compute it on gene x cell matrix.
Seurat uses irlba (Fast Truncated Singular Value Decomposition and Principal Components Analysis for Large Dense and Sparse Matrices) for PCA.
The irlba is both faster and more memory efficient than the usual R svd function for computing a few of the largest singular vectors and corresponding singular values of a matrix.
By default, RunPCA computes the PCA on the cell (n) x gene (p) matrix.
One thing to note is that in linear algebra, a matrix is coded as n (rows are observations) X p (columns are features). That’s why by default, the gene x cell original matrix is transposed first to cell x gene: irlba(A = t(x = data.use), nv = pcs.compute, ...).
After irlba, the v matrix is the gene loadings, the u matrix is the cell embeddings.
number of significant PCs
For downstream analysis, e.g. {Seurat::FindClusters} only the PCs that significantly contribute to the variation of the data are used. Seruat uses JackStraw and JackStrawplot function to achieve it.
JackStraw:
Randomly permutes a subset of data, and calculates projected PCA scores for these ‘random’ genes. Then compares the PCA scores for the ‘random’ genes with the observed PCA scores to determine statistical significance. End result is a p-value for each gene’s association with each principal component.
JackStrawplot:
Plots the results of the JackStraw analysis for PCA significance. For each PC, plots a QQ-plot comparing the distribution of p-values for all genes across each PC, compared with a uniform distribution. Also determines a p-value for the overall significance of each PC.The p-value for each PC is based on a proportion test comparing the number of genes with a p-value below a particular threshold (score.thresh), compared with the proportion of genes expected under a uniform distribution of p-values.
The other day, I saw a tweet on permute the original matrix to calculate the significance of the PCs. I forget the original tweet, but this is from a retweet: https://twitter.com/MattOldach/status/1075037756563382274
references: This is called Horn’s Parallel Analysis (original paper https://link.springer.com/article/10.1007%2FBF02289447 and a modification https://journals.sagepub.com/doi/abs/10.1177/0013164495055003002?journalCode=epma. It’s a great method for removing noisy components.
This is not exactly the same as what Seurat is doing, but the idea is similar.
I want to put it down here for my future reference.
permutation “test” for PCA
The code below is copied from that tweet, credit goes to the author.
pca_eigenperm<- function(data, nperm = 1000){
        pca_out<- prcomp(data, scale. = T)
        eigenperm<- data.frame(matrix(NA, nperm, ncol(data)))
        n<- ncol(data)
        data_i<- data.frame(matrix(NA, nrow(data), ncol(data)))
        for (j in 1: nperm){
        for (i in 1:n){
                data_i[,i]<- sample(data[,i], replace = F)
        }
        pca.perm<- prcomp(data_i, scale. = T)
        eigenperm[j,]<- pca.perm$sdev^2
        }
        colnames(eigenperm)<- colnames(pca_out$rotation)
        eigenperm

}
We will use the same NCI60 data set for demonstration.
library(tidyverse)## ── Attaching packages ──────────────────────────────────────────────────────────────── tidyverse 1.2.1 ──## ✔ ggplot2 3.1.0 ✔ purrr 0.2.5
## ✔ tibble 1.4.2 ✔ dplyr 0.7.8
## ✔ tidyr 0.8.2 ✔ stringr 1.3.1
## ✔ readr 1.3.1 ✔ forcats 0.3.0## ── Conflicts ─────────────────────────────────────────────────────────────────── tidyverse_conflicts() ──
## ✖ dplyr::filter() masks stats::filter()
## ✖ dplyr::lag() masks stats::lag()library(ggplot2)
library(ISLR)
ncidat<- NCI60$data
rownames(ncidat)<- NCI60$labs
dim(ncidat)## [1] 64 6830fa_pca_perm<- pca_eigenperm(t(ncidat))
fa_pca<- prcomp(t(ncidat))
fa_pca_rand95<-
data.frame(Random_Eigenvalues = sapply(fa_pca_perm, quantile, 0.95)) %>%
#95% percentile of randome eigenvalues
mutate(PC = colnames(fa_pca$rotation)) %>%
#add PC IDs as discrete var
cbind(Eigenvalues = fa_pca$sdev^2)
#combine rand95 with real eigenvals
## only the first 9 PCs
fa_pca_rand95_long<-
gather(fa_pca_rand95[1:9, ], key = Variable, value = Value, -PC)
ggplot(fa_pca_rand95_long, aes(PC, Value, fill = Variable)) +
geom_bar(stat = "identity", position = position_dodge())+
labs(y="Eigenvalue", x="", fill= "") +
theme_classic()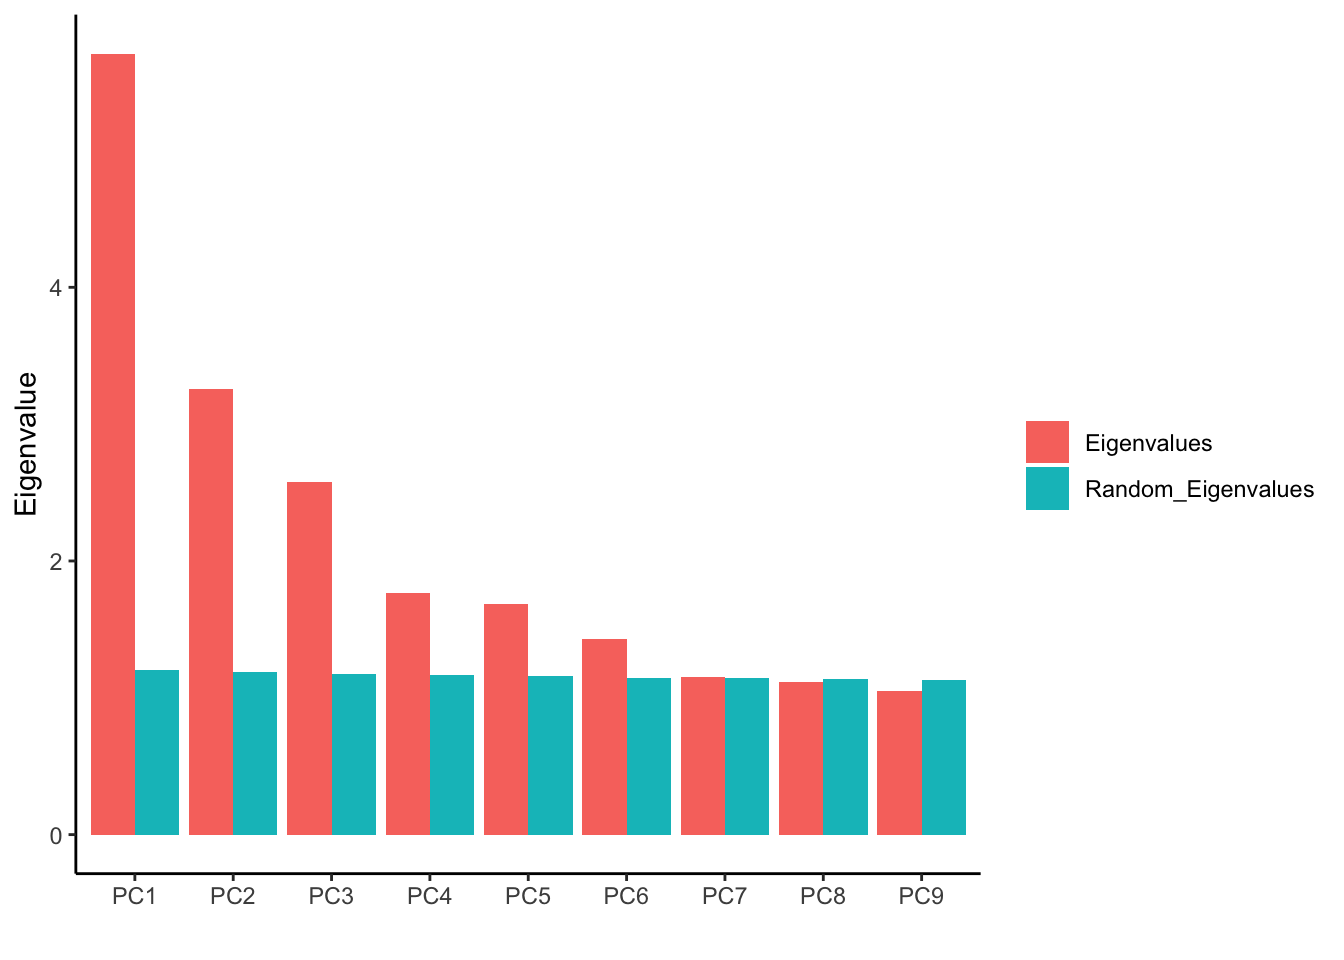
We see after PC6, the Eigenvalues are almost the same with the permuted data.
For single cell data, permutation can take a long time, that’s why in JackStraw there is an
option prop.freq (Proportion of the data to randomly permute for each replicate) to
permute only a subset of the data matrix.