In a typical “barnyard” experiment in which cells from different species are mixed before loading to the 10x controller, the identification of the species of origin after mapping/counting with the hybrid reference is a problem. People tend to use the ratio of reads mapped to each reference genome to determine which species a cell is from.
In this paper https://www.biorxiv.org/content/10.1101/630087v1.full
To deconvolute species, detect doublets and low quality cells, the mixed-species mapped data was used. Cells for which >70% of the reads mapped to only one species were assigned to the corresponding species. The remaining cells (those for which <70% of the reads mapped to only one species) were removed from the downstream analysis.
kallisto bustool https://bustools.github.io/BUS_notebooks_R/10xv2.html uses 90% as a cutoff.
However, how to choose this cutoff is subjective. In this blog post, I will mix a mouse and a human 10x single cell RNAseq dataset in silicon and then map to the hybrid transriptome. We have the ground truth of which cell comes from which species so we can investigate the mapping rate.
Download data
Download 1k pbmc data and 1k mouse brain data from 10x website.
cd /n/holylfs/LABS/informatics/mtang/projects/dj/10x_mouse_human_mixing
wget http://cf.10xgenomics.com/samples/cell-exp/3.0.0/neuron_1k_v3/neuron_1k_v3_fastqs.tar

wget http://cf.10xgenomics.com/samples/cell-exp/3.0.0/pbmc_1k_v3/pbmc_1k_v3_fastqs.tar

## after tar xvf
ls neuron_1k_v3_fastqs/
neuron_1k_v3_S1_L001_I1_001.fastq.gz  neuron_1k_v3_S1_L001_R2_001.fastq.gz  neuron_1k_v3_S1_L002_R1_001.fastq.gz
neuron_1k_v3_S1_L001_R1_001.fastq.gz  neuron_1k_v3_S1_L002_I1_001.fastq.gz  neuron_1k_v3_S1_L002_R2_001.fastq.gz

ls pbmc_1k_v3_fastqs/
pbmc_1k_v3_S1_L001_I1_001.fastq.gz  pbmc_1k_v3_S1_L001_R2_001.fastq.gz  pbmc_1k_v3_S1_L002_R1_001.fastq.gz
pbmc_1k_v3_S1_L001_R1_001.fastq.gz  pbmc_1k_v3_S1_L002_I1_001.fastq.gz  pbmc_1k_v3_S1_L002_R2_001.fastq.gz
add species barcode to the R1 fastq
Different experiment could have barcode collisions, let’s add additional barcode in front of the original cell barcode.
save the below as a add_species_barcode.sh:
This script adds a 8 base pair barcode in front of the R1 reads (16bp cell barcode + 12 bp umi for 10x version3) and some dummy high quality score (I) to the quality line.
#! /bin/bash
set -euo pipefail

zcat $1 |  awk -v barcode="$2" 'NR%4 == 2 {$0=barcode$0} NR%4==0 {$0="IIIIIIII"$0} {print}' | gzip  > $3
I am adding AAAAAAAA and TTTTTTTT to mouse and human data, respectively.
chmod u+x add_species_barcode.sh

./add_species_barcode.sh neuron_1k_v3_fastqs/neuron_1k_v3_S1_L001_R1_001.fastq.gz AAAAAAAA neuron_1k_v3_fastqs/neuron_1k_v3_S1_L001_R1_001_modified.fastq.gz


./add_species_barcode.sh neuron_1k_v3_fastqs/neuron_1k_v3_S1_L002_R1_001.fastq.gz AAAAAAAA neuron_1k_v3_fastqs/neuron_1k_v3_S1_L002_R1_001_modified.fastq.gz


./add_species_barcode.sh pbmc_1k_v3_fastqs/pbmc_1k_v3_S1_L001_R1_001.fastq.gz TTTTTTTT pbmc_1k_v3_fastqs/pbmc_1k_v3_S1_L001_R1_001_modified.fastq.gz


./add_species_barcode.sh pbmc_1k_v3_fastqs/pbmc_1k_v3_S1_L002_R1_001.fastq.gz TTTTTTTT pbmc_1k_v3_fastqs/pbmc_1k_v3_S1_L002_R1_001_modified.fastq.gz
build a hybrid index for kallisto.
kallisto uses cDNA for indexing.
Note kb-python uses genomics DNA and gtf file for making reference (it will extract the cDNA from genomic DNA based on gtf file). I tested kb-python for a single species experiment and it worked well and saves you doing all the steps. However, kb ref requires the fasta and gtf files to be merged for creating the hybrid reference. I may try it next time.
## download the cDNA for mouse and human
wget ftp://ftp.ensembl.org/pub/release-96/fasta/mus_musculus/cdna/Mus_musculus.GRCm38.cdna.all.fa.gz
wget ftp://ftp.ensembl.org/pub/release-96/fasta/homo_sapiens/cdna/Homo_sapiens.GRCh38.cdna.all.fa.gz

## download the gtf files
wget ftp://ftp.ensembl.org/pub/release-96/gtf/mus_musculus/Mus_musculus.GRCm38.96.gtf.gz
wget ftp://ftp.ensembl.org/pub/release-96/gtf/homo_sapiens/Homo_sapiens.GRCh38.96.gtf.gz

kallisto index -i GRCh38_GRCm38/GRCh38_GRCm38_96.idx Homo_sapiens.GRCh38.cdna.all.fa.gz Mus_musculus.GRCm38.cdna.all.fa.gz
kallisto count at transcript level
Note 10x V2 R1 is 16bp cell barcode + 10 bp umi, V3 R1 is 16 bp cell barcode + 12 bp umi.
See my previous post https://divingintogeneticsandgenomics.rbind.io/post/understand-10x-scrnaseq-and-scatac-fastqs/
kallisto bus -i /n/holylfs/INTERNAL_REPOS/INFORMATICS/reference_genome_by_tommy/kallisto_bus_ref/GRCh38_GRCm38_96.idx -o mouse_human_kallisto_out -x 0,0,24:0,24,36:1,0,0 -t8 \
neuron_1k_v3_fastqs/neuron_1k_v3_S1_L001_R1_001_modified.fastq.gz \
neuron_1k_v3_fastqs/neuron_1k_v3_S1_L001_R2_001.fastq.gz \
neuron_1k_v3_fastqs/neuron_1k_v3_S1_L002_R1_001_modified.fastq.gz \
neuron_1k_v3_fastqs/neuron_1k_v3_S1_L002_R2_001.fastq.gz \
pbmc_1k_v3_fastqs/pbmc_1k_v3_S1_L001_R1_001_modified.fastq.gz \
pbmc_1k_v3_fastqs/pbmc_1k_v3_S1_L001_R2_001.fastq.gz \
pbmc_1k_v3_fastqs/pbmc_1k_v3_S1_L002_R1_001_modified.fastq.gz \
pbmc_1k_v3_fastqs/pbmc_1k_v3_S1_L002_R2_001.fastq.gz

[index] k-mer length: 31
[index] number of targets: 307,242
[index] number of k-mers: 208,670,671
[index] number of equivalence classes: 1,276,238
[quant] will process sample 1: neuron_1k_v3_fastqs/neuron_1k_v3_S1_L001_R1_001_modified.fastq.gz
                               neuron_1k_v3_fastqs/neuron_1k_v3_S1_L001_R2_001.fastq.gz
[quant] will process sample 2: neuron_1k_v3_fastqs/neuron_1k_v3_S1_L002_R1_001_modified.fastq.gz
                               neuron_1k_v3_fastqs/neuron_1k_v3_S1_L002_R2_001.fastq.gz
[quant] will process sample 3: pbmc_1k_v3_fastqs/pbmc_1k_v3_S1_L001_R1_001_modified.fastq.gz
                               pbmc_1k_v3_fastqs/pbmc_1k_v3_S1_L001_R2_001.fastq.gz
[quant] will process sample 4: pbmc_1k_v3_fastqs/pbmc_1k_v3_S1_L002_R1_001_modified.fastq.gz
                               pbmc_1k_v3_fastqs/pbmc_1k_v3_S1_L002_R2_001.fastq.gz
[quant] finding pseudoalignments for the reads ... done
[quant] processed 159,504,118 reads, 97,750,679 reads pseudoaligned
bustools count at gene level
we need a transcript to gene mapping tsv file making from gtf file. I could not find the t2g.py script mentioned in the tutorial.
make a transcript to gene mapping file using unix command line. also read my previous blog post: https://divingintogeneticsandgenomics.rbind.io/post/how-to-make-a-transcript-to-gene-mapping-file/
zcat Homo_sapiens.GRCh38.96.gtf.gz | grep -v "#" | awk '$3=="transcript"' | cut -f9 | tr -s ";" " " | awk -v OFS="\t" '{print$6"\t"$2"\t"$10}' | sort | uniq |  sed 's/\"//g' > Homo_sapiens.GRCh38.96.tsv


zcat Mus_musculus.GRCm38.96.gtf.gz | grep -v "#" | awk '$3=="transcript"' | cut -f9 | tr -s ";" " " | awk -v OFS="\t" '{print$6"\t"$2"\t"$10}' | sort | uniq |  sed 's/\"//g' > Mus_musculus.GRCm38.96.tsv

## merge the tsv
cat Homo_sapiens.GRCh38.96.tsv Mus_musculus.GRCm38.96.tsv > GRCh38_GRCm38.96.tsv
correct to the whitelist and bustools count at gene level
wget https://github.com/BUStools/getting_started/releases/download/species_mixing/10xv3_whitelist.txt

wc -l 10xv3_whitelist.txt
6794880 10xv3_whitelist.txt
There are valid 68k cell barcodes from 10x. we added the species barcode in front of them and use bustool to correct for sequencing errors.
# add the same species barcode to it.
cat 10xv3_whitelist.txt | awk '{print "AAAAAAAA"$0}' > whitelist1.txt
cat 10xv3_whitelist.txt | awk '{print "TTTTTTTT"$0}' > whitelist2.txt
cat whitelist1.txt whitelist2.txt > whitelist.txt

mkdir tmp genecount

bustools correct -w whitelist.txt -p mouse_human_kallisto_out/output.bus | \
bustools sort -T tmp/ -t 4 -p - | \
bustools count -o genecount/genes \
-g /n/holylfs/INTERNAL_REPOS/INFORMATICS/reference_genome_by_tommy/kallisto_bus_ref/GRCh38_GRCm38.96.tsv \
-e mouse_human_kallisto_out/matrix.ec -t mouse_human_kallisto_out/transcripts.txt --genecounts -

Found 13589760 barcodes in the whitelist

Number of hamming dist 1 barcodes = 461228268
Processed 97750679 bus records
In whitelist = 94311259
Corrected = 329059
Uncorrected = 3110361
Read in 94640318 BUS records
Warning it is not working!! 0 genes were mapped when I checked the genes.genes.txt.
The devil is that kallisto infers the transcript id from the cDNA fasta file which contains the .2 version number, but in the gtf file the version number is in the transcript_version 2 entry.
The easiest way is to remove the version number in the transcript.txt file from output.
# make a backup
cp transcripts.txt transcripts.bc.txt

# check how the version number look like for all genes
cat transcripts.txt | cut -d. -f2 | sort | uniq
1
10
11
12
13
14
15
16
17
2
3
4
5
6
7
8
9

cat transcripts.txt | sed -r 's/\.[0-9]?//' > transcript2.txt

## rerun bustool but feeding the transcript2.txt
rm -rf genecount/*

bustools correct -w whitelist.txt -p mouse_human_kallisto_out/output.bus | \
bustools sort -T tmp/ -t 4 -p - | \
bustools count -o genecount/genes \
-g /n/holylfs/INTERNAL_REPOS/INFORMATICS/reference_genome_by_tommy/kallisto_bus_ref/GRCh38_GRCm38.96.tsv \
-e mouse_human_kallisto_out/matrix.ec -t mouse_human_kallisto_out/transcript2.txt --genecounts -
Alternative ways
- The R package BUSpaRse has a function to take care of that to make a transcript to gene mapping file from cDNA fasta. https://bustools.github.io/BUS_notebooks_R/10xv2.html
library(BUSpaRse)
tr2g <- transcript2gene(fasta_file = c("./data/hs_cdna.fa.gz", "./data/mm_cdna.fa.gz"),
kallisto_out_path = "./output/out_hgmm1k")kb-pythoncommandkb reftakes genomic DNA fasta and gtf files and makes the index and a transcript to gene mapping file on the fly.
load in to R
following https://bustools.github.io/BUS_notebooks_R/10xv2.html
library(BUSpaRse)
library(tidyverse)
library(DropletUtils)
library(Matrix)
library(Seurat)

res_mat <- read_count_output("~/Downloads/genecount",name = "genes", tcc = FALSE)

dim(res_mat)
## [1] 71600 731356remove some of the empty droplets
tot_counts <- Matrix::colSums(res_mat)
summary(tot_counts)
## Min. 1st Qu. Median Mean 3rd Qu. Max.
## 0.00 1.00 1.00 34.89 5.00 142612.00# Compute barcode rank from Dropletutils
bc_rank <- barcodeRanks(res_mat)
qplot(bc_rank$total, bc_rank$rank, geom = "line") +
geom_vline(xintercept = bc_rank$knee, color = "blue", linetype = 2) +
geom_vline(xintercept = bc_rank$inflection, color = "green", linetype = 2) +
annotate("text", y = 1000, x = 1.5 * c(bc_rank$knee, bc_rank$inflection),
label = c("knee", "inflection"), color = c("blue", "green")) +
scale_x_log10() +
scale_y_log10() +
labs(y = "Barcode rank", x = "Total UMI count")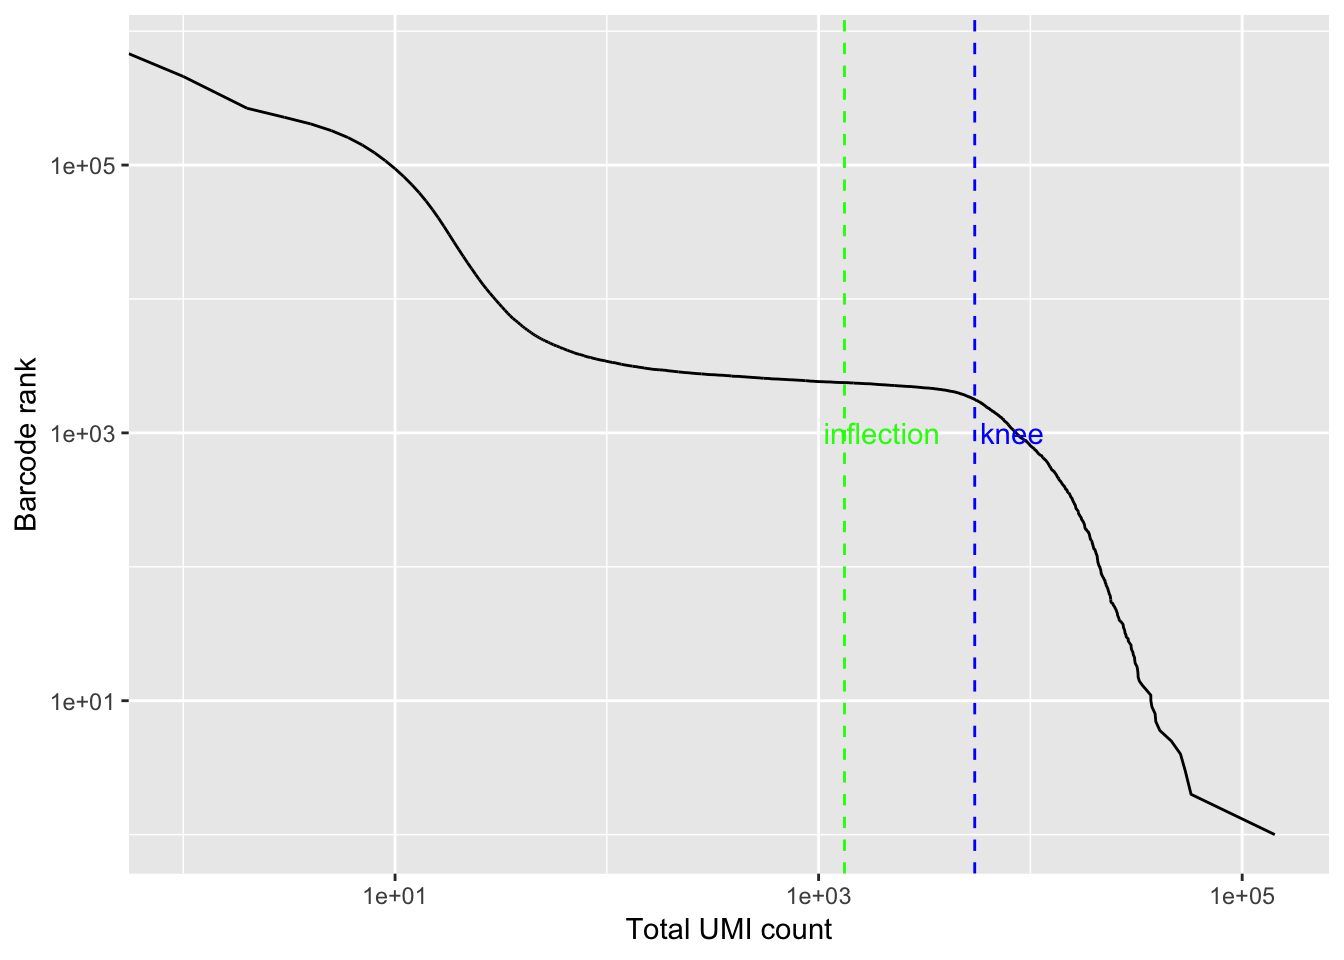
filter the cells
# Filter the matrix
res_mat <- res_mat[, tot_counts > bc_rank$inflection]
dim(res_mat)
## [1] 71600 2375Now, we get around 2000 cells.
gene_species <- ifelse(str_detect(rownames(res_mat), "^ENSMUSG"), "mouse", "human")
mouse_inds <- gene_species == "mouse"
human_inds <- gene_species == "human"
# mark cells as mouse or human
cell_species <- tibble(n_mouse_umi = Matrix::colSums(res_mat[mouse_inds,]),
                       n_human_umi = Matrix::colSums(res_mat[human_inds,]),
                       tot_umi = Matrix::colSums(res_mat),
                       prop_mouse = n_mouse_umi / tot_umi,
                       prop_human = n_human_umi / tot_umi)
ground truth
str_detect(colnames(res_mat), "^AAAAAAAA") %>% table()## .
## FALSE TRUE
## 1169 1206str_detect(colnames(res_mat), "^TTTTTTTT") %>% table()## .
## FALSE TRUE
## 1206 1169We have 1206 mouse cells and 1169 human cells
cell_species<- cell_species %>%
  mutate(ground_truth = case_when(
    str_detect(colnames(res_mat), "^AAAAAAAA") ~ "mouse",
    str_detect(colnames(res_mat), "^TTTTTTTT") ~ "human"
  ))

p1<- ggplot(cell_species, aes(x = ground_truth, y = prop_mouse)) +
  geom_boxplot(aes(color = ground_truth))

p2<- ggplot(cell_species, aes(x = ground_truth, y = prop_human)) +
  geom_boxplot(aes(color = ground_truth))

p<- cowplot::plot_grid(
  p1 + theme(legend.position="none"),
  p2 + theme(legend.position="none"),
  align = 'vh')

## add back the legend
legend <- cowplot::get_legend(
  # create some space to the left of the legend
  p1 + theme(legend.box.margin = margin(0, 0, 0, 12))
)

# add the legend to the row we made earlier. Give it one-third of
# the width of one plot (via rel_widths).
cowplot::plot_grid(p, legend, rel_widths = c(2, .4))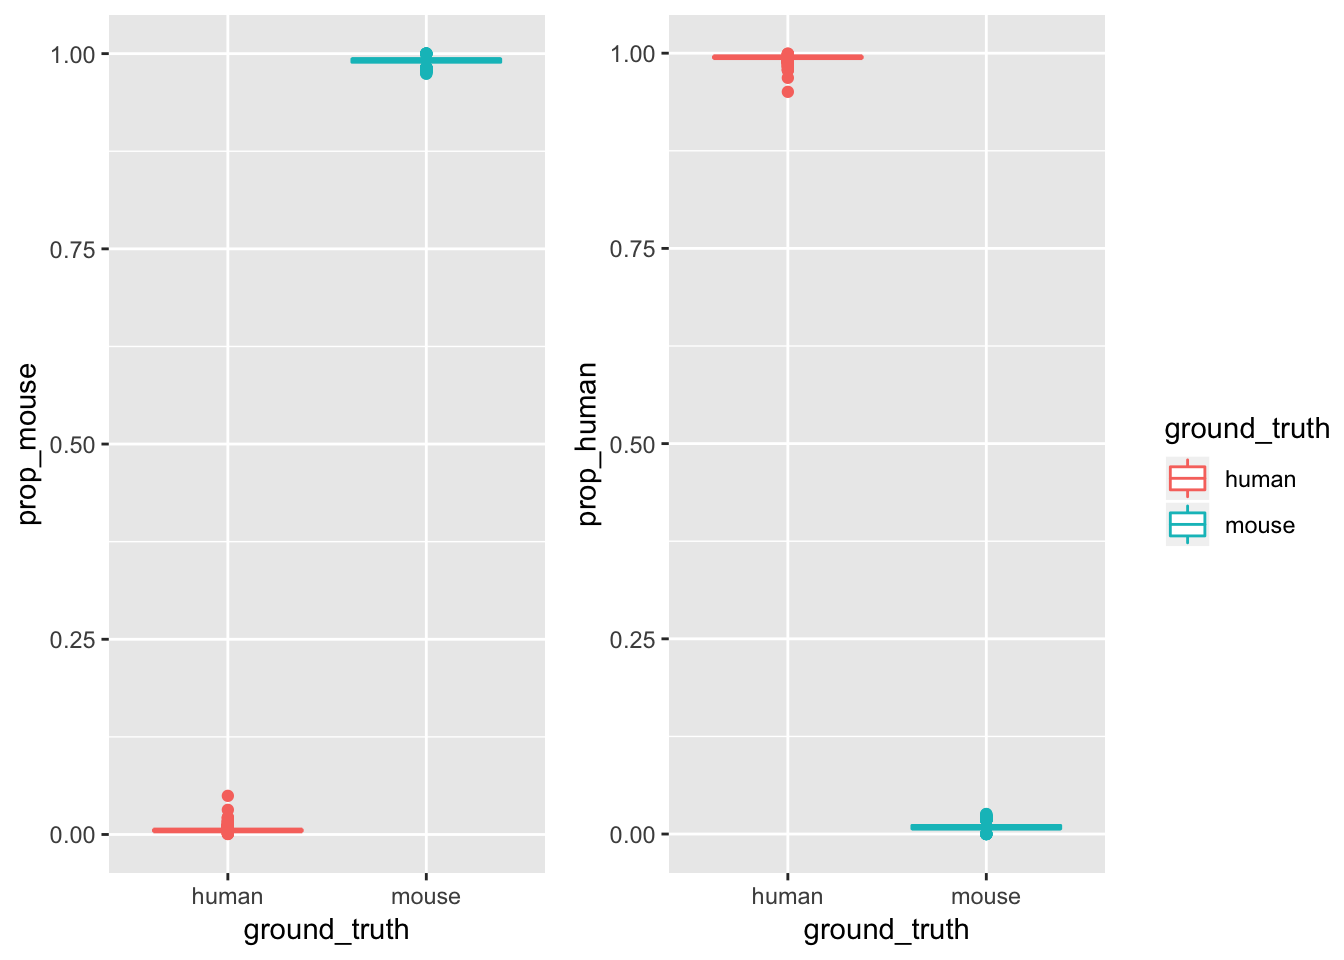
minimal and maximal proportion for mapping rate.
# min 95%
cell_species$prop_human[cell_species$ground_truth == "human"] %>%
  range()
## [1] 0.9505135 0.9994325# max 5%
cell_species$prop_mouse[cell_species$ground_truth == "human"] %>%
range()## [1] 0.0005675369 0.0494864613# min 97%
cell_species$prop_mouse[cell_species$ground_truth == "mouse"] %>%
range()## [1] 0.9743096 1.0000000# max 2%
cell_species$prop_human[cell_species$ground_truth == "mouse"] %>%
range()## [1] 0.00000000 0.02569043assign species of origin by the proportion
cell_species<- cell_species %>%
  mutate(ground_truth = case_when(
    str_detect(colnames(res_mat), "^AAAAAAAA") ~ "mouse",
    str_detect(colnames(res_mat), "^TTTTTTTT") ~ "human"
  )) %>%
  mutate(species = case_when(
    prop_mouse > 0.9 ~ "mouse",
    prop_human > 0.9 ~ "human",
    TRUE ~ "mixed"
  ))

table(cell_species$ground_truth, cell_species$species)
##
## human mouse
## human 1169 0
## mouse 0 1206This makes a 100% match as expected.
Seurat for dimension reduction and visualization
seu <- CreateSeuratObject(res_mat, min.cells = 3) %>%
  NormalizeData(verbose = FALSE) %>%
  ScaleData(verbose = FALSE) %>%
  FindVariableFeatures(verbose = FALSE)

seu <- AddMetaData(seu, metadata = cell_species$ground_truth, col.name = "species")
seu <- RunPCA(seu, verbose = FALSE, npcs = 30)
seu <- RunTSNE(seu, dims = 1:20, check_duplicates = FALSE)
DimPlot(seu, reduction = "pca", pt.size = 0.5, group.by = "species")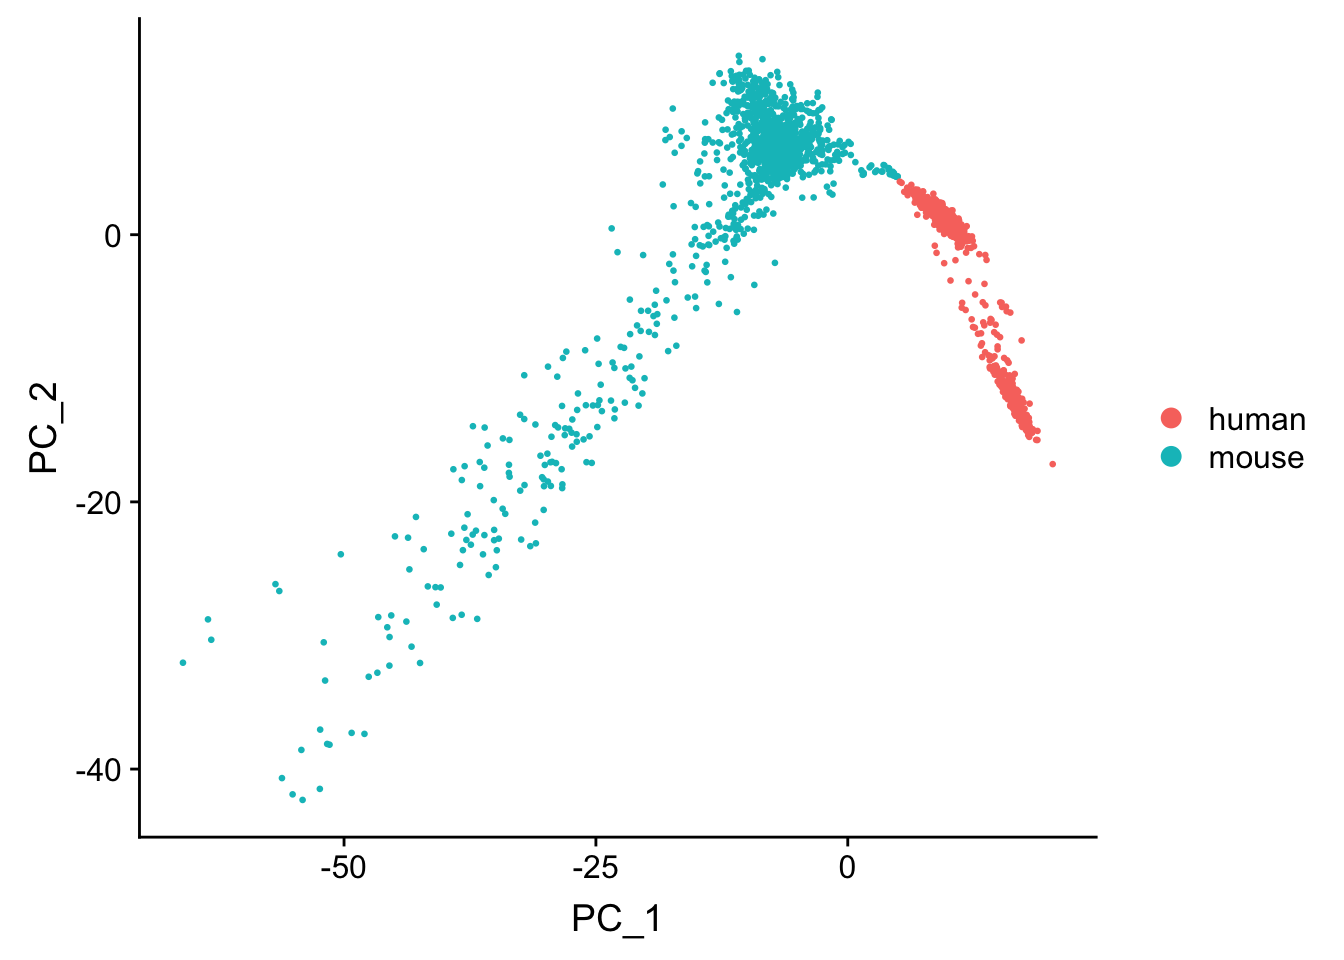
DimPlot(seu, reduction = "tsne", pt.size = 0.5, group.by = "species")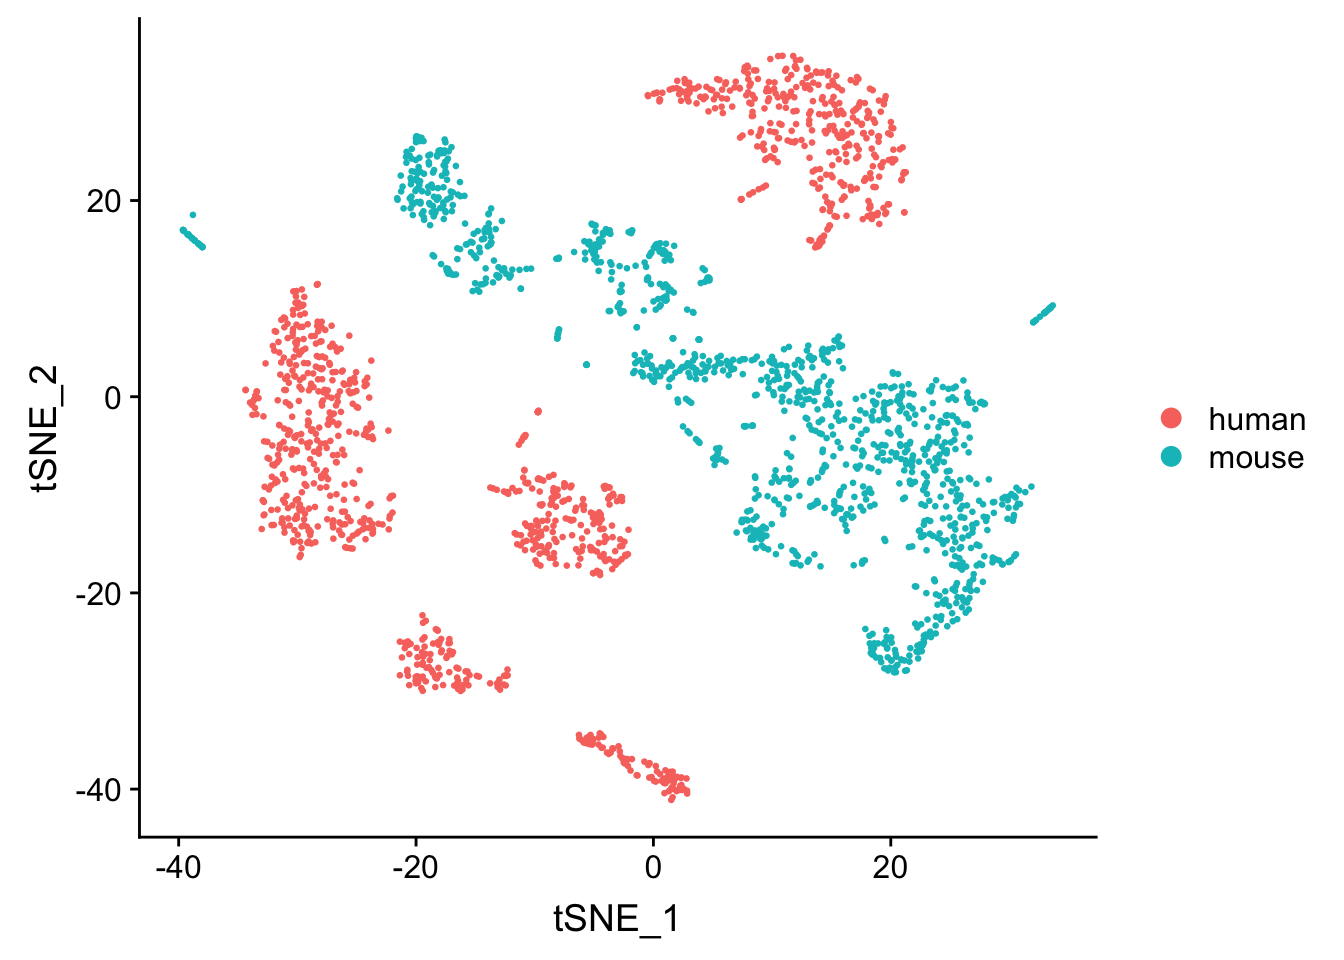
conclusion
Using ratio of mapped reads for each cell to identify the cell of origin works pretty well for mouse and human mixtures. what if we use a more close species to human say chimpanzee or monkeys? Also, in a real experiment, one may have doublets from different species.
The mapping ratio is so drasticially different so a much smaller cutoff can still seperate the sepecies very well. This could be due to the cell type difference. It will be interesting to do the same experiment but with human pbmc and mouse pbmc cells.
I used the hybrid reference for mapping. How it will look like if I map the human cells with the mouse reference or map the mouse cells with the human reference?